ABET Assessment Results for AY 2016-17
Summary
The data for AY 2016-17 was used as part of our continuing improvement process
in the Fall of 2017.
| Outcome |
% Excelled |
% Mastered |
% Partially Mastered |
% Below Expectations |
#Student Assessments |
| (a) |
61 |
10 |
12 |
18 |
104 |
| (b) |
34 |
39 |
7 |
20 |
146 |
| (c) |
31 |
62 |
4 |
3 |
296 |
| (d) |
12 |
84 |
3 |
1 |
215 |
| (e) |
92 |
6 |
0 |
2 |
200 |
| (f) |
22 |
54 |
21 |
2 |
129 |
| (g) |
NaN |
NaN |
NaN |
NaN |
0 |
| (h) |
NaN |
NaN |
NaN |
NaN |
0 |
| (i) |
70 |
23 |
2 |
5 |
43 |
| (j) |
34 |
17 |
31 |
18 |
160 |
| (k) |
NaN |
NaN |
NaN |
NaN |
0 |
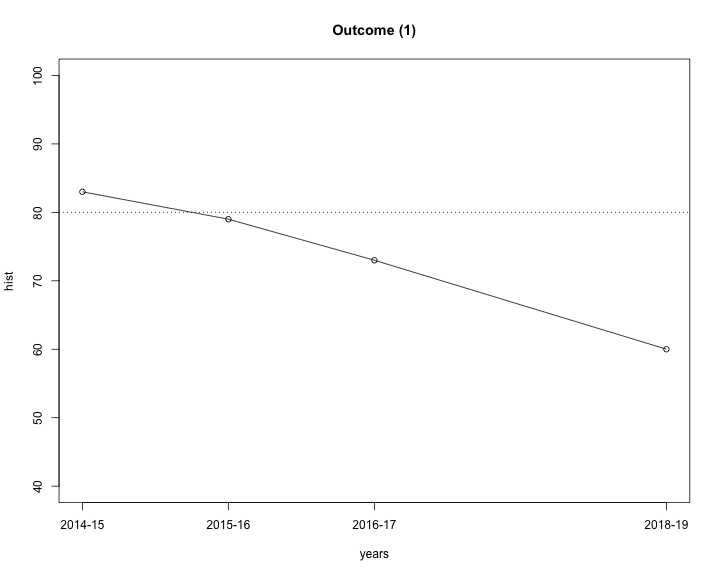
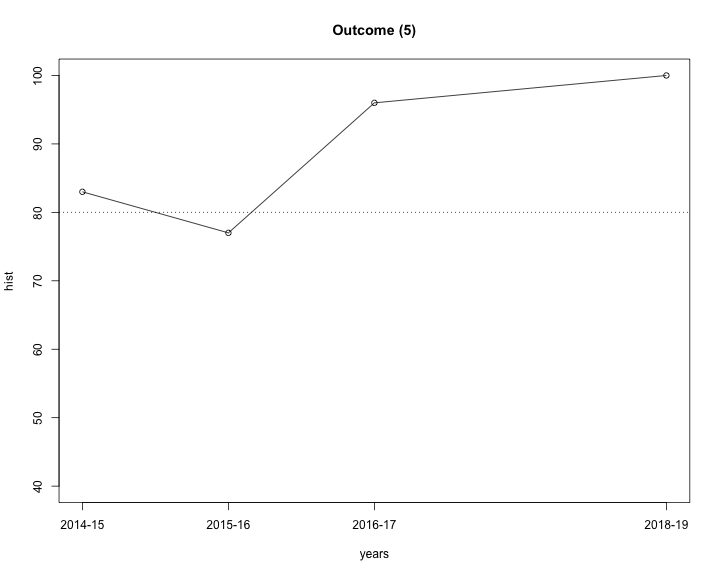
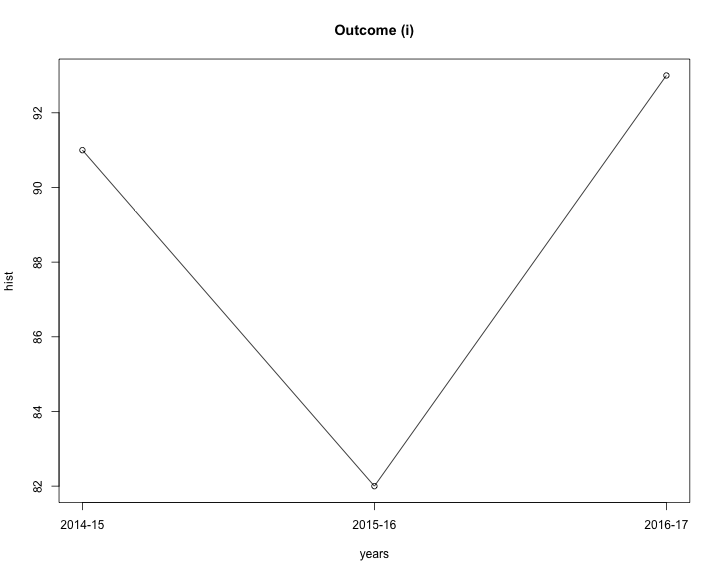
Considering Excelled and Mastered to “Satisfy” each student outcome, we can look at historical trends.
| Outcome |
%Satisfied 2014-15 |
%Satisfied 2015-16 |
%Satisfied 2016-17 |
Last Year Change |
| (a) |
72 |
80 |
71 |
-9 |
| (b) |
83 |
79 |
73 |
-6 |
| (c) |
79 |
80 |
93 |
13 |
| (d) |
83 |
77 |
96 |
19 |
| (e) |
100 |
100 |
98 |
-2 |
| (f) |
89 |
96 |
76 |
-20 |
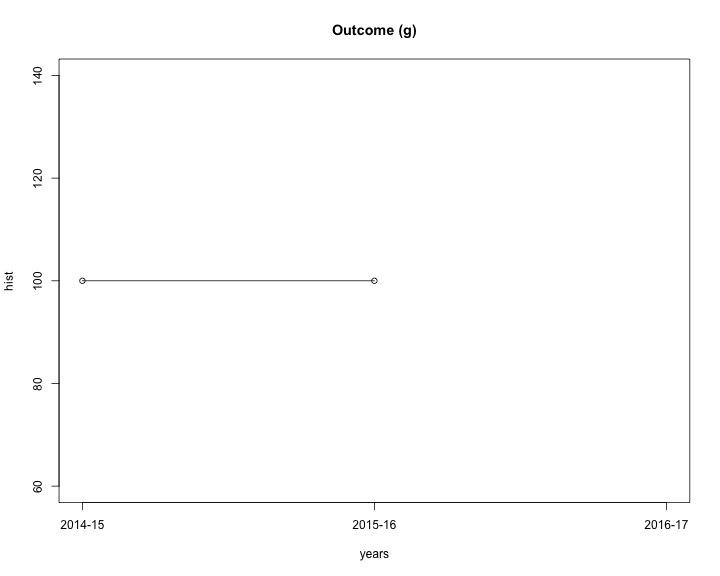
| (g) |
100 |
100 |
NaN |
NaN |
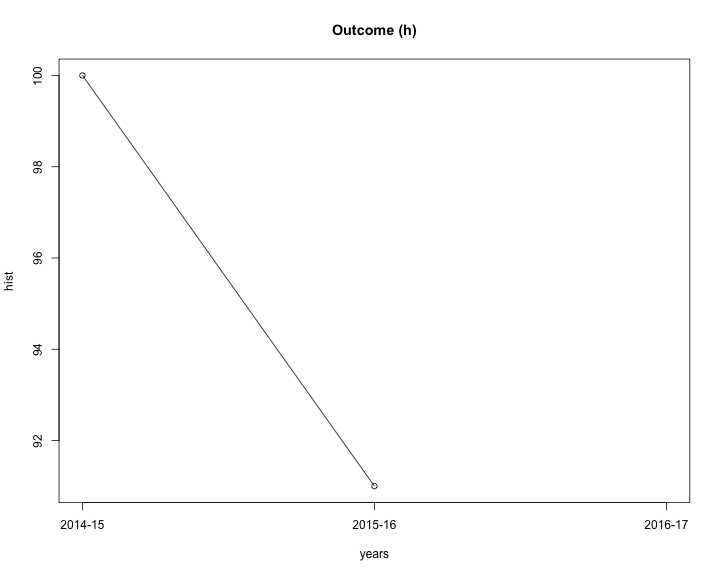
| (h) |
100 |
91 |
NaN |
NaN |
| (i) |
91 |
82 |
93 |
11 |
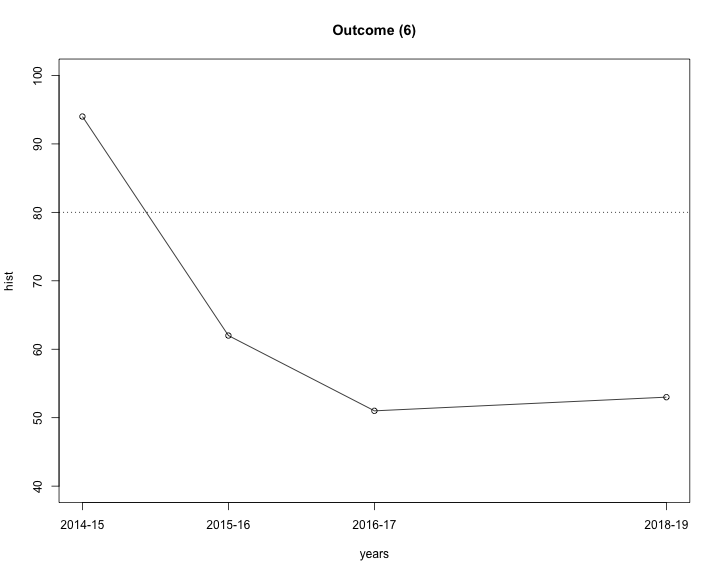
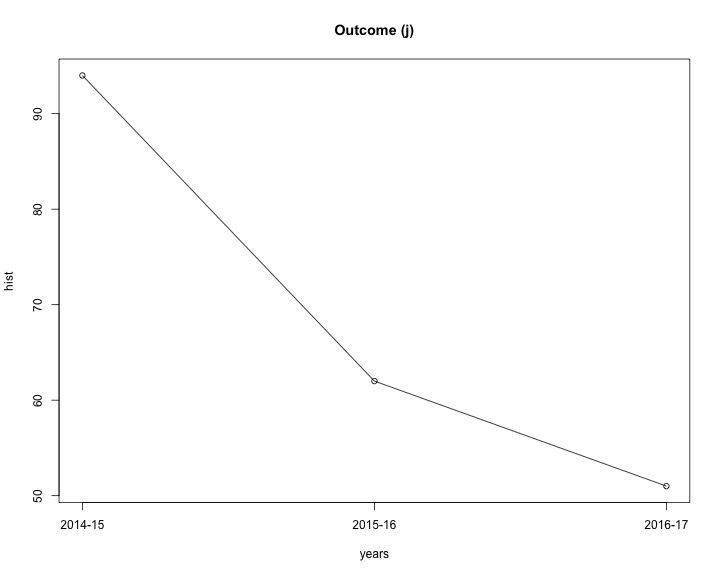
| (j) |
94 |
62 |
51 |
-11 |
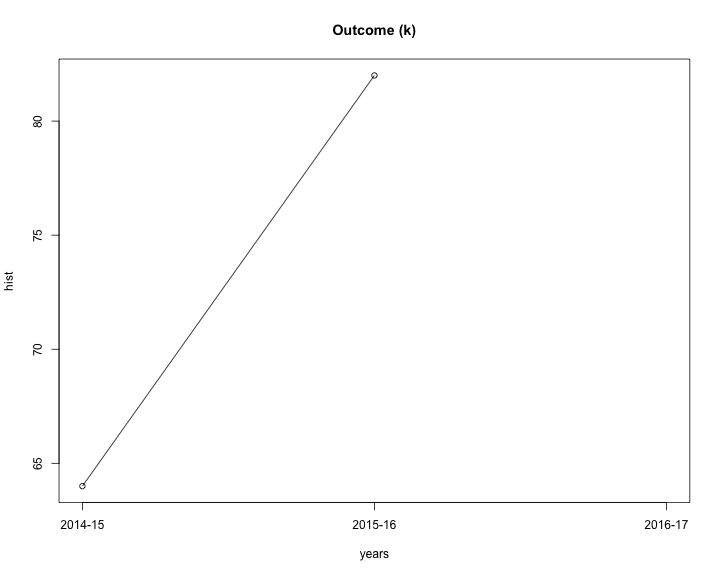
| (k) |
64 |
82 |
NaN |
NaN |
TODO: As the table shows, the percentage of students who satisfy each outcome is mostly the same in
the two years for which we have data. The outcomes (j) and (k) show the most difference, and
we attribute this to a better understanding of the assessment process among the faculty, as
opposed to any real change in student performance. We will, of course, continue to monitor
this closely in the next years.
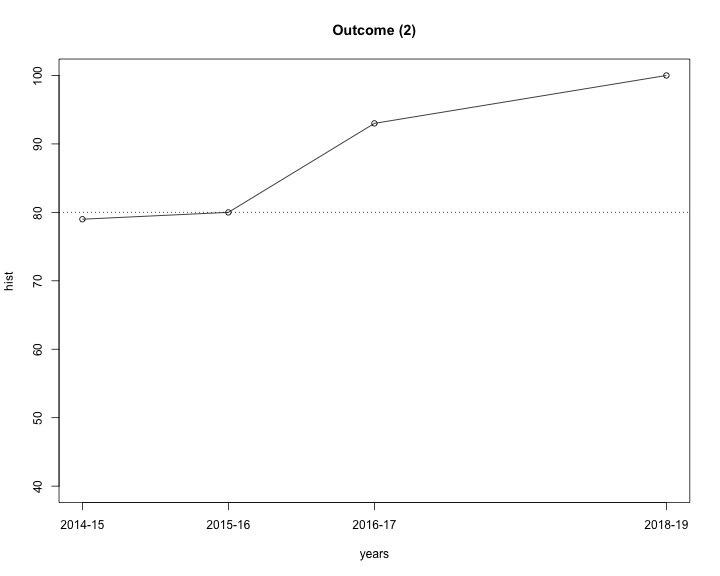
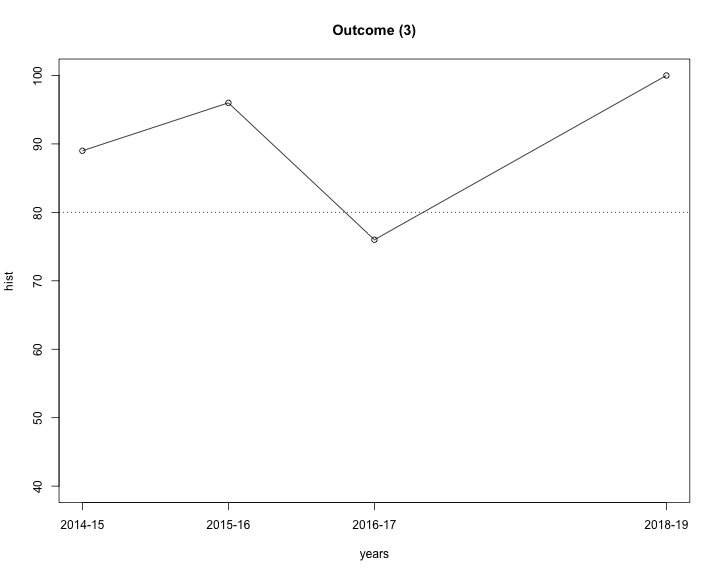
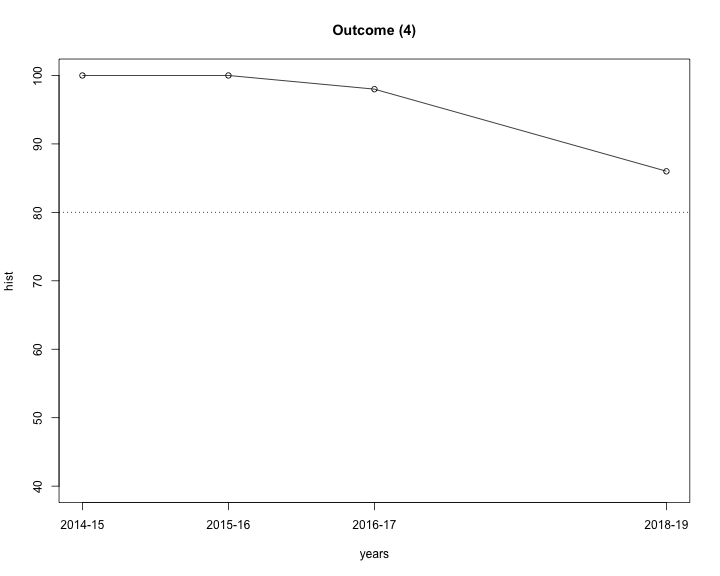
The following graphs show the history of the outcomes (a) through (k).
More details of student assessment can be seen by considering the assessment of individual PKIs.
| Outcome |
KPI |
% Excelled |
% Mastered |
% Partially Mastered |
% Below Expectations |
#Student Assessments |
| (a) |
(a.1) |
83 |
6 |
12 |
0 |
52 |
| |
(a.2) |
62 |
19 |
12 |
8 |
26 |
| |
(a.3) |
15 |
8 |
12 |
65 |
26 |
| |
(a.4) |
NaN |
NaN |
NaN |
NaN |
0 |
| |
(a.5) |
NaN |
NaN |
NaN |
NaN |
0 |
| |
(a.6) |
NaN |
NaN |
NaN |
NaN |
0 |
| (b) |
(b.1) |
29 |
26 |
12 |
32 |
34 |
| |
(b.2) |
36 |
43 |
5 |
16 |
112 |
| (c) |
(c.1) |
0 |
100 |
0 |
0 |
46 |
| |
(c.2) |
0 |
100 |
0 |
0 |
46 |
| |
(c.3) |
40 |
50 |
4 |
6 |
121 |
| |
(c.4) |
58 |
19 |
16 |
7 |
43 |
| |
(c.5) |
45 |
55 |
0 |
0 |
40 |
| (d) |
(d.1) |
0 |
100 |
0 |
0 |
43 |
| |
(d.2) |
0 |
100 |
0 |
0 |
43 |
| |
(d.3) |
58 |
19 |
16 |
7 |
43 |
| |
(d.4) |
0 |
100 |
0 |
0 |
43 |
| |
(d.5) |
0 |
100 |
0 |
0 |
43 |
| (e) |
(e.1) |
90 |
8 |
0 |
2 |
50 |
| |
(e.2) |
90 |
8 |
0 |
2 |
50 |
| |
(e.3) |
90 |
8 |
0 |
2 |
50 |
| |
(e.4) |
98 |
2 |
0 |
0 |
50 |
| (f) |
(f.1) |
42 |
51 |
7 |
0 |
43 |
| |
(f.2) |
14 |
70 |
16 |
0 |
43 |
| |
(f.3) |
12 |
42 |
40 |
7 |
43 |
| (g) |
(g.1) |
NaN |
NaN |
NaN |
NaN |
0 |
| |
(g.2) |
NaN |
NaN |
NaN |
NaN |
0 |
| (h) |
(h.1) |
NaN |
NaN |
NaN |
NaN |
0 |
| |
(h.2) |
NaN |
NaN |
NaN |
NaN |
0 |
| |
(h.3) |
NaN |
NaN |
NaN |
NaN |
0 |
| (i) |
(i.1) |
0 |
100 |
0 |
0 |
5 |
| |
(i.2) |
79 |
13 |
3 |
5 |
38 |
| |
(i.3) |
NaN |
NaN |
NaN |
NaN |
0 |
| |
(i.4) |
NaN |
NaN |
NaN |
NaN |
0 |
| (j) |
(j.1) |
15 |
0 |
54 |
31 |
26 |
| |
(j.2) |
39 |
24 |
36 |
0 |
33 |
| |
(j.3) |
71 |
24 |
0 |
6 |
34 |
| |
(j.4) |
9 |
6 |
61 |
24 |
33 |
| |
(j.5) |
29 |
26 |
12 |
32 |
34 |
| (k) |
(k.1) |
NaN |
NaN |
NaN |
NaN |
0 |
| |
(k.2) |
NaN |
NaN |
NaN |
NaN |
0 |
| |
(k.3) |
NaN |
NaN |
NaN |
NaN |
0 |
| |
(k.4) |
NaN |
NaN |
NaN |
NaN |
0 |
Assessment Data
COSC 1010: Intro to Programming, Allyson Anderson
| Core Course |
KPIs |
Outcomes |
| COSC 1010: Intro to Programming |
(i.2) |
(i) |
Performance Indicator (i.2): Program in Java, including use of the Java collections and other useful
Java frameworks

Homework 8:  The salesReport project allows an employee to enter a simple daily sales report and prints out the results. The employee must enter his username and password. After verifying the username and password, the program allows the employee to enter his sales details for the day. Sales details include the product name, product ID#, price, and quantity sold. An object should be created for each product and then added to the daily collection of product objects. When the salesperson is finished entering data, the program calculates the total cash value of the salesperson's sales for the day and prints out the report.

38 students were assessed.
30 excelled
5 mastered
1 partially mastered
2 failed
COSC 2030: Programming II, Tom Bailey
| Core Course |
Assessed |
| COSC 2030: Programming II |
Yearly |
Performance Indicator (i.1): Program in C++, including use of the C++ Standard Library
Performance Indicator (i.3): Use an IDE to edit, compile, and debug a program
COSC 2300: Discrete Structures, Ruben Gamboa
| Core Course |
Assessed |
| COSC 2300: Discrete Structures |
Yearly |
Performance Indicator (a.1): Use discrete mathematics techniques

 Final Question 1:
    Propositional reasoning

 26 students were assessed.

 23 students excelled.
  0 students mastered.
  3 students partially mastered.
  0 student was below expectations.

 Final Question 2:
    Predicate reasoning

 26 students were assessed.

 20 students excelled.
  3 students mastered.
  3 students partially mastered.
  0 student was below expectations.
Performance Indicator (a.2): Estimate cardinality of relevant events
                             in computing applications

 Final Question 9
   counting and discrete probability

 26 students were assessed.

 16 students excelled.
  5 students mastered.
  3 students partially mastered.
  2 students were below expectations.
Performance Indicator (a.3): Use mathematical induction to prove
                             mathematical formulas that arise
                             in computing applications

 Final Question 7
   structural induction

 24 students were assessed.

  4 students excelled.
  2 student mastered.
  3 students partially mastered.
 17 student was below expectations.

 Note: This PKI is being assessed differently than in previous years. We used to assess using mathematical
 induction, but now we are assessing structural induction in the context of a functional program, which is
 considerably more difficult. The results are significantly down this year, but we expect that to come back
 up in future years.
COSC 3011: Software Design, Kim Buckner
| Core Course |
Assessed |
| COSC 3011: Software Design |
Yearly |
Performance Indicator (b.2): Analyze at least two or more proposed solutions
to given problem and select the best solution for the given problem.

This was assessed through the program design project. The teams were required to plan, design, and program a game. This was in five steps over the majority of the semester with the sixth, wrap-up due as the final.
I have combined the results of the first five steps of the programming project as I did for the course grade.

68 students were assessed.

Excelled: 30 students
Mastered: 39 students
Partially Mastered: 2 students
Below Expectations: 7
Performance Indicator (c.3): Design the selected solution for a given problem.

This was assessed through the program design project. The teams were required to plan, design, and program a game. This was in five steps over the majority of the semester with the sixth, wrap-up due as the final.
I have combined the results of the first five steps of the programming project as I did for the course grade.

68 students were assessed.

Excelled: 30 students
Mastered: 39 students
Partially Mastered: 2 students
Below Expectations: 7
Performance Indicator (k.2): Describe commonly used design patterns.
Performance Indicator (k.3): Design the selected solution for a given problem.
COSC 3020: Algorithms & Data Structures, Lars Kotthoff
| Core Course |
Assessed |
| COSC 3020: Algorithms & Data Structures |
Every other year, starting 2016-17 |
Performance Indicator (a.4): Calculate the sum of arithmetic series
                             that arise in computing applications
Performance Indicator (a.5): Calculate the sum of geometric series
                             that arise in computing applications
Performance Indicator (a.6) : Use calculus to find the asymptotic limit of functions
Performance Indicator (b.1) :  Identify key components and algorithms necessary for a solution

Assignment 3: Implement two algorithms for solving the traveling salesman
problem and compare them.

34 students assessed.

10 students excelled.
9 students mastered.
4 students partially mastered.
11 students were below expectations.
Performance Indicator (b.2) :  Analyze at two or more proposed solutions to a given problem and select the best solution for the given problem

Assignment 3: Implement two algorithms for solving the traveling salesman
problem and compare them.

34 students assessed.

10 students excelled.
9 students mastered.
4 students partially mastered.
11 students were below expectations.
Performance Indicator (j.1) :  Analyze the asymptotic cost of divide-and-conquer algorithms

Question 3 in assignment 2: Implement an iterative and in-place version of merge
sort and analyze its complexity.

31 students assessed.

4 students excelled.
5 students mastered.
14 students partially mastered.
8 students were below expectations.
Performance Indicator (j.2) :  Analyze the asymptotic cost of recursive algorithms

Question 3 in the midterm: Give Theta-bounds for three recurrence
relations.

33 students assessed.

13 students excelled.
8 students mastered.
12 students partially mastered.
0 students were below expectations.
Performance Indicator (j.3): Analyze the asymptotic cost of basic graph algorithms

Lab 7: Implement the Floyd-Warshall algorithm and analyze its complexity.

34 students assessed.

24 students excelled.
8 students mastered.
2 students were below expectations.
Performance Indicator (j.4):  Describe the impact of techniques such as caching
and dynamic programming on the performance of algorithms

Question 5 in final: Implement a dynamic programming solution to
compute the Liouville number.

33 students assessed.

3 students excelled.
2 students mastered.
20 students partially mastered.
8 students were below expectations.
Performance Indicator (j.5):  Understand the difference between polynomial
and exponential complexity

Assignment 3: Implement two algorithms for solving the traveling salesman
problem (one complete, exponential complexity, one approximate, polynomial
complexity) and compare them.

34 students assessed.

10 students excelled.
9 students mastered.
4 students partially mastered.
11 students were below expectations.
COSC 3050: Ethics, Kim Buckner
| Core Course |
Assessed |
| COSC 3050: Ethics |
Every other year, starting 2016-17 |
Performance Indicator (e.1): Recognize ethical issues involved in a
professional setting.

As such I will provide documents relating to the individual topics but only one assessment for student performance for the entire course. There were 24 students assessed.
The assessment consisted of the following.

Reading their quiz answers and giving full credit if they had an answer at all and that answer was for the question asked. This was the portion that to a large extent caused the students to read the provided material.

There were 50 students assessed for the two sections of the course.

Excelled: 45 students
Mastered: 4
Partially Mastered: 0
Below Expectations: 1
Performance Indicator (e.2): Describe current issues in security.

As such I will provide documents relating to the individual topics but only one assessment for student performance for the entire course. There were 24 students assessed.
The assessment consisted of the following.

Reading their quiz answers and giving full credit if they had an answer at all and that answer was for the question asked. This was the portion that to a large extent caused the students to read the provided material.

There were 50 students assessed for the two sections of the course.

Excelled: 45 students
Mastered: 4
Partially Mastered: 0
Below Expectations: 1
Performance Indicator (e.3): Describe current issues in privacy.

As such I will provide documents relating to the individual topics but only one assessment for student performance for the entire course. There were 24 students assessed.
The assessment consisted of the following.

Reading their quiz answers and giving full credit if they had an answer at all and that answer was for the question asked. This was the portion that to a large extent caused the students to read the provided material.

There were 50 students assessed for the two sections of the course.

Excelled: 45 students
Mastered: 4
Partially Mastered: 0
Below Expectations: 1
Performance Indicator (e.4): Respect and honor ethics in writing assignments.

Their final papers were all reasonable, the biggest problems being grammatical errors es- pecially for our foreign students.

There were 50 students assessed for the two sections of the course.

Excelled: 49 students
Mastered: 4
Partially Mastered: 0
Below Expectations: 1
Performance Indicator (g.1): Understand the impact of computing solutions on
society in a global economic context.
Performance Indicator (g.2): Describe non-technical computing issues such as
sustainability, entrepreneurship, and outsourcing.
Performance Indicator (h.1): Read and report on papers in the technical literature.
Performance Indicator (h.3): Review articles, chapters, or presentations from the
professional literature.